
If I Can't Be Part of the Solution...
Leaning in on our polling obsession...hopefully helpfully


At the beginning of the month, I put up - as is my wont - a long post covering a variety of subjects, one of which was an assessment of the presidential race that included a caution about fixating on polling.
My caution remains valid, but since that post, a couple of noteworthy things have happened that make a return to the topic worth doing. My goal here is not to add to anyone’s OCD but rather that more information - and a conversation among the smart people who subscribe to the LiIT - will make us all smarter consumers of what’s yet to come.
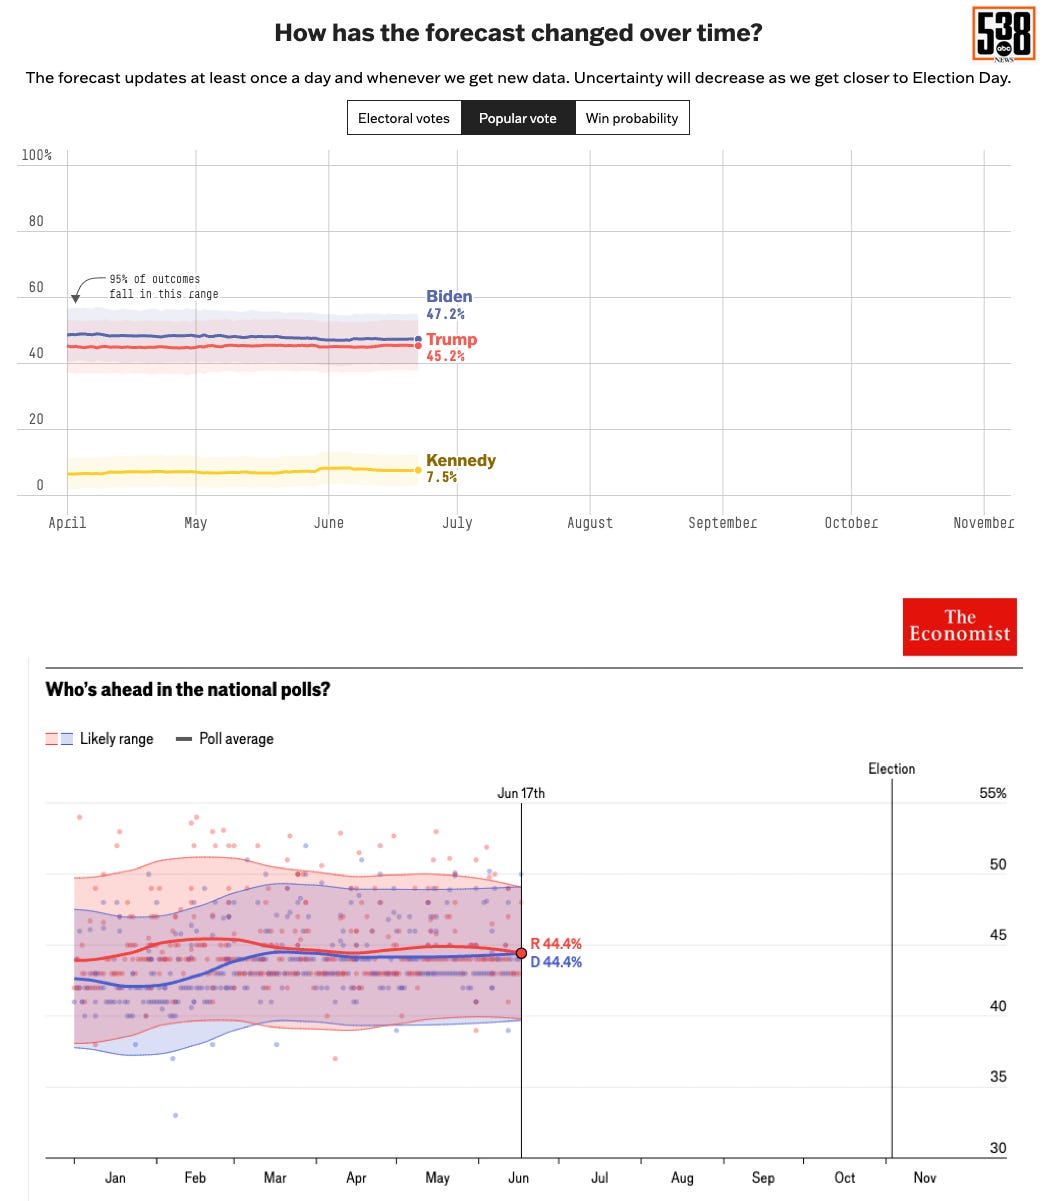
The return of the predictors. Since 2016, one of the most popular - and derided - features of the presidential elections has been the websites that purport to give odds - very precise odds, in fact - on the state of the race and the outcome of the election. The pioneer in this space - Nate Silver’s FiveThirtyEight - is now an asset of ABC News but returned this year for its third run:

Shortly after the 538 model debuted, the Economist unveiled its predictor.1 I recollect its debut was in 2020, but my memory is sometimes oddly out of sync with reality.

Quite a difference in those headlines, isn’t there? The Economist one, in particular, is noteworthy because, by their calculation, Mr. Trump is twice as likely to win the 2024 election as President Biden. Let’s dig into their methodologies to see if there’s a ready explanation that might account for the difference.
First, and very much to their credit, both publications extensively explain their methodologies. The Economist’s is here and 538’s here. Having spent some time with both articles, I am sure I cannot do justice to explaining the methodological differences, but from my layperson’s perspective, it boils down to:2
The Economist starts with a baseline model built on what is known in the business as “fundamentals,” which are the non-polling metrics that have historically been predictive of election results. These metrics fall into two categories: economic factors like GDP, employment, inflation, etc. and political factors such as presidential job approval. It kinda-sorta says its fundamental model is similar to “a model called ‘Time for Change.’ [that] was designed by Alan Abramowitz” but doesn’t detail the differences. The magazine then uses polling results - state and national - to adjust the results in ways that are described but not quantified.
528, conversely, starts with polling, specifically the weighted averages of state and national polls. The weighting is based on lots of factors, including sample size, currency, and - in particular - 538’s assessment of the pollster’s historical reliability. A poll from an organization whose surveys have proven accurate is accorded more weight than one with a weaker track record. Those averages are then adjusted for the fundamental factors that the Economist starts with.
Take what you will from the methodologies, but what matters to me is that both sites’ headlines - a toss-up, 50/50 election or a 2-1 odds of a Trump win - obscure the reality that both predictions contain margins of error so broad as to render any conclusion speculative at best. This is best illustrated - to me anyway - by these graphics, showing how the range of possible outcomes for the popular vote include Biden winning by eight points as well as Biden losing by nearly the same amount:3
This range - referred to as the “margin of error” - is just one of the ways a headline might vary from reality. The Economist’s methodology explainer details how other factors might influence the numbers we see:
However, this number only contemplates one potential source of error: the risk that a perfectly random sample of a given size may not reflect the characteristics of the population as a whole (known as “sampling error”). In fact, the group of people who participate in any given survey are virtually never an idealised random sub-set of the population that will actually turn out to vote. Instead, they can differ from the eventual mix in important ways, which collectively are known as “non-sampling error”.
First, polls are subject to the vagaries of voter turnout. Polls conducted among all adults will include the views of people who are ineligible or not registered to vote. Those limited to registered voters treat all respondents in this group as if they had an equal probability of showing up to vote, which they surely do not. And those that seek to filter out respondents unlikely to vote, or that grant more weight to the views of people who are more likely to show up, can get such calculations wrong. Although no two surveys are identical, ones that use a similar approach to predicting turnout are more likely to wind up with errors of a similar size and direction than are ones that handle it differently. In statistical terms, each of these different methods of turnout projection can produce a “bias”, which is likely to contaminate the results of all the pollsters that use it in a similar way.
The same is true of other sources of non-sampling error. The group of people pollsters can reach by using live telephone interviewers may have different voting intentions than those they can reach by automated phone calls, or via the internet. Individual pollsters may make methodological choices, such as weighting schemes, that consistently lead to more or less favourable results for a particular political party.
These are not easy questions to answer, but the answers are critical to a survey’s outcome. If, for example, you believe that more low-engagement voters who care about inflation and immigration will turn out on election day than historical trends, your survey will likely favor Mr. Trump. If you think single-issue reproductive rights voters are highly motivated this election cycle and weight their participation accordingly, advantage President Biden. And on and on.
And now for something completely different…a non-polling electoral predictor.
If you’re looking for an alternative to the fog of polling, a recent article in Politico offers a credible option. Historian Allan Lichtman, working with Vladimir Keilis-Borok, an expert in earthquake prediction, has an election prediction model called “The 13 Keys to the White House” that has accurately forecasted the outcome of every presidential election since 1984.4 This track record includes predicting Donald Trump’s unexpected victory in 2016.
Lichtman and Keilis-Borok’s model doesn’t rely on conventional political analysis, though it feels closer to the “fundamentals” approach described above. Instead of a political spectrum of “left-right” or “liberal-conservative interpretation, the model draws an analogy between political stability and earthquakes, where the "earthquake" represents a change in the ruling party. According to Wikipedia, the model is based on 13 assessments known as "keys" that include:
Party mandate: After the midterm elections, the incumbent party holds more seats in the U.S. House of Representatives than after the previous midterm elections.
No primary contest: There is no serious contest for the incumbent party nomination.
Incumbent seeking re-election: The incumbent party candidate is the sitting president.
No third party: There is no significant third party or independent campaign.
Strong short-term economy: The economy is not in recession during the election campaign.
Strong long-term economy: Real per capita economic growth during the term equals or exceeds mean growth during the previous two terms.
Major policy change: The incumbent administration effects major changes in national policy.
No social unrest: There is no sustained social unrest during the term.
No scandal: The incumbent administration is untainted by major scandal.
No foreign/military failure: The incumbent administration suffers no major failure in foreign or military affairs.
Major foreign/military success: The incumbent administration achieves a major success in foreign or military affairs.
Charismatic incumbent: The incumbent party candidate is charismatic or a national hero.
Uncharismatic challenger: The challenging party candidate is not charismatic or a national hero.
If six or more of the keys are false — meaning they cut against the party holding the White House — you have an earthquake.
Lichtman has yet to make a final prediction for the upcoming election, citing that it is still too early and significant developments could occur. He noted that President Biden has definitively lost two keys: the mandate key, due to the Democrats losing House seats in 2022, and the incumbent charisma key, as Biden lacks the personal appeal of historical figures like Franklin Roosevelt or John F. Kennedy.
Lichtman also points out that another four keys remain uncertain: third-party influence, social unrest, foreign/military failures, and foreign/military successes. Even so, his informal assessment at this point is that “A lot would have to go wrong for Biden to lose. It could happen. But a lot would have to go wrong.”
Of the four keys in play, the biggest wild card is - to me at least - the third-party key, where Robert F. Kennedy Jr. is showing fluctuating but meaningful support. Social unrest, which was seeping into the public consciousness this spring with the campus protests, seems to have receded. Foreign policy is more uncertain to me as the U.S. is not directly enmeshed in conflicts abroad but is closely tied to what’s happening in Gaza and Ukraine. Setbacks - or successes - there could have an effect.
On the other side, Lichtman also notes that the model he and his colleague created doesn’t account for “black swan” sorts of events such as - notably - a presidential candidate being convicted of 34 felonies.
I would love to get a conversation going around this issue. A disproportionate number of us have political experience, and some of us - not your author - have math skills. And if you know any actual pollsters, please invite them to the club and make us all smarter.
About the header image: I asked Midjourney - which remains my go-to AI for image creation - “In the style of Peter Max, a surveyor standing on the steps of a house holding a clipboard conducting a survey of voter preferences, soliciting the opinions of a family clustered in the doorway.” There’s no family and not much that says polling but I like the colors so I went with it.
Apologies if the Economist is behind a paywall. I don’t think it is but I’ve had mixed results on that point in putting this post together.
Do not hesitate to call bullshit on me for either oversimplifying or completely missing the most important points of difference; we are probably a few steps beyond the ragged edge of my knowledge here.
Some will note these are measuring different things and that’s true. Still, they illustrate the same point: polling numbers reflect a pollster’s belief that if you conducted the underlying survey 100 times, 95 times would produce results within the margin of error, with each outcome equally likely.
Lichtman argues that Al Gore was the rightful winner in 2000.
As always, a thoughtful and useful commentary. Most media and pundits (and some candidates, usually to their regret) put way too much emphasis on the horse race question of who is leading whom. Add to that the fact that in presidential elections it doesn’t matter who is leading in surveys of voters across the country; the voters in the half dozen or so swing states will decide the outcome. And, in a race as tight as the one between Biden and Trump, opinions can change in a heartbeat - literally. Imagine how quickly the race would change if Biden has a medical event of any kind.
That’s not to say that surveys aren’t worthwhile. The “numbers behind the numbers” - the data that show WHY public opinion is as it is and the values and issues of voters that are most determinant. And there is a story. Trump pretty clearly needs either a large turnout or he needs to depress Biden’s. Raising questions about Biden’s mental and physical health are effective to a point, but they lastly take votes from Biden. Trump is vulnerable because he has done little to expand his appeal. When he tries - the absurd proposal to eliminate taxes on tipped income, for example - he may gain a few voters, but he raises new questions about his grasp of policy.
Biden is relying on the four things the polls tell his campaign: he can’t convince enough people that the economy is as good as it really is, so stop trying; abortion and broader issues of reproductive health energize the Democratic base like no other issue; raising fears about Trump’s instability and often crazy notions (see tax-free tips above) may drive those same voters who went for Biden in record numbers in 2020; and, at the end of the day, campaign logistics will matter as much as anything. On that last point, Democrats have a huge advantage in already having strong get-out-the-vote systems in place.
As an add-on to Jon’s call for a conversation, it would be interesting to know which candidate readers think will win (regardless of how they intend to vote), why, and how their opinion squares with the public surveys.